5 big data storytelling tools to explore in 2023
- Manuela Toteva

- Mar 13, 2023
- 2 min read
Data storytelling is a crucial aspect of data analysis, as it helps you communicate the insights you've discovered to your stakeholders so they can easily understand and act upon them.
To help you tell your data-driven stories, here are the top five data storytelling tools:
Tableau
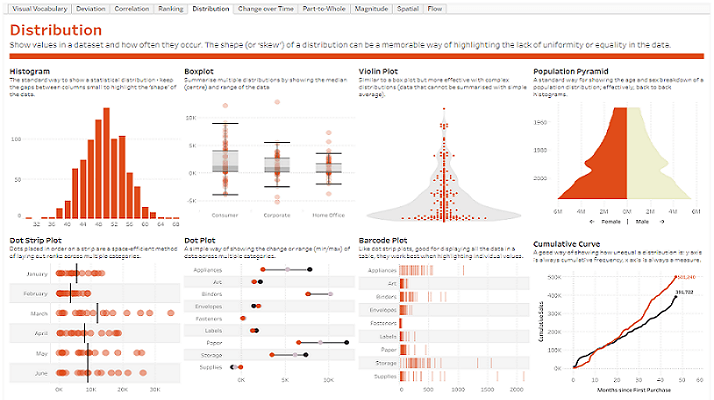
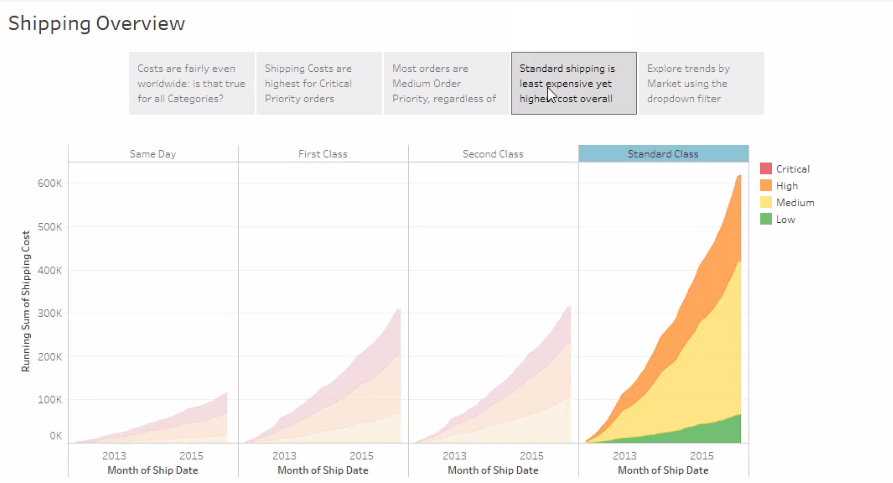
Tableau is a popular data visualization and business intelligence tool that allows you to create interactive and engaging dashboards, reports, and infographics. With its drag-and-drop interface, you can quickly connect to data sources, blend data from multiple sources, and create compelling visualizations that help you tell your data story effectively. Tableau also offers storytelling features, such as story points, annotations, and animations, that enable you to create a narrative around your data insights and share them with your audience.
Power BI
Power BI is a business analytics service provided by Microsoft that allows you to create interactive dashboards and reports from various data sources. With Power BI, you can easily connect to your data, transform it, and create custom visualizations that help you communicate your insights. Power BI also offers storytelling features, such as bookmarks and drill-throughs, that enable you to create a narrative around your data insights and share them with your audience.

Datawrapper
Datawrapper is a simple and powerful tool for creating data visualizations that are easy to read and understand. With Datawrapper, you can make interactive charts, maps, and tables and customize them to match your brand's style. Datawrapper also offers storytelling features, such as annotations and legends, that help you create a narrative around your data insights and make them more accessible to your audience.

Google Data Studio
Google Data Studio is a free data visualization tool that allows you to create custom reports and dashboards from various data sources. With its drag-and-drop interface, you can quickly build visualizations that help you tell your data story effectively. Google Data Studio also offers storytelling features, such as report-level filters and page-level navigation, that enable you to create a narrative around your data insights and share them with your audience.
Infogram
Infogram is a data visualization tool that allows you to create interactive and engaging infographics, reports, and presentations. With Infogram, you can create custom charts, maps, and tables and add text and images to create a compelling data story. Infogram also offers storytelling features, such as annotations and callouts, that enable you to create a narrative around your data insights and share them with your audience.
In conclusion, these five data storytelling tools are powerful tools that can help you communicate your data insights to your audience effectively. Whether you're creating interactive dashboards or engaging infographics, these tools can help you tell your data-driven stories in a way that your stakeholders can easily understand and act upon.


Comments